
Anthropic published an analysis of 100,000 conversations showing 80% time savings.[2] Both results are valid within their own scope.
The question is not which study to trust. It is what each study is actually measuring and why conflating the two units of analysis produces every bad AI productivity decision made at scale. This piece explains why each number is right within its own scope, how the bottleneck shift works, and what to instrument instead.
What Each Study’s Methodology Actually Measures
The scope boundary is the entire explanation. Each study’s clock starts and stops at a different point in the delivery pipeline.

Anthropic used CLIO, a privacy-preserving LLM-as-judge system, to analyse real Claude.ai conversations.[2] For each conversation, Claude estimated the time a human professional would need to complete the same task without AI. The approach was validated against JIRA tickets. Claude’s estimates achieved a Spearman correlation of ρ=0.44 against actual completion times; experienced human estimators achieved ρ=0.50.[2] Anthropic is transparent about what this means: the ρ=0.44 is directionally useful at population scale, and the authors state explicitly that “Claude’s predictions are imperfect and we lack real-world validation.”[2]
The occupational taxonomy matters too. Anthropic mapped tasks to O*NET categories — a macroeconomic database designed for discrete, independently completable work units. Software engineering, where tasks are entangled with codebase context, review dependencies, and deployment pipelines, fits that model better at the macroeconomic level than at the team delivery level.[2]
METR used a randomised controlled trial: issues randomly assigned to AI-permitted and AI-prohibited conditions, controlling for developer, repository, and task type.[1] Screen recordings provided objective timing independent of self-report. Participants used production tooling — Cursor Pro with Claude 3.5 and 3.7 Sonnet.[1]
What Anthropic measured: AI-assisted time savings on self-contained tasks within a single conversation window, aggregated across a population of self-selected Claude.ai users.
What METR measured: wall clock time to close a real delivery unit on a production codebase, including all overhead of AI interaction, prompt iteration, output verification, integration debugging, and context recovery after interruptions.
The operational consequence is that most internal AI pilot metrics inherit the Anthropic boundary by default. Developers self-report task speed. The measurement stops at the task edge. Lead time, cycle time, and deployment frequency are not in scope.
What the Anthropic Paper’s Numbers Actually Represent
The median task in the dataset takes 1.4 hours without AI and carries $55 in professional labour value.[2] That is the scope Anthropic’s 80% applies to: bounded, single-session, and individual work. Software developers represent 19% of projected economy-wide productivity gains in the model.[2]
The most important table in the paper is the one rarely shown in slide decks. Anthropic published RCT results across multiple AI application contexts, and the spread provides a more complete picture than the headline figure.[2]
| Task type (unnamed in source) | Time saved |
|---|---|
| Context 1 | 56% |
| Context 2 | 40% |
| Context 3 | 26% |
| Context 4 | 14% |
| Context 5 | Negative |
Anthropic does not name these task contexts individually in the published paper.[2] Writing and analysis tasks cluster toward the high end; software engineering tasks show higher variance and cluster lower.
Anthropic included the negative result — a mark of methodological transparency. The full picture their data presents is wide-spread, task-type-sensitive, and not a single number.
The macroeconomic projection is 1.8% annual US labour productivity growth if AI were universally adopted over ten years, which applies these task-time savings to BLS employment weights.[2] The authors describe it as a potential “approximate lower bound” contingent on model capability improvement.[2] It assumes tasks are substitutable and additive gains compound. Neither assumption holds at the team delivery level.
Little’s Law and the Bottleneck That Moved
Faros instrumented 22,000 developers across 4,000 teams.[3] High AI adoption correlates with 21% more tasks completed and 98% more pull requests opened per developer.[3] DORA metrics at the organisation level: no significant correlation with deployment frequency, lead time, or change failure rate.[3]
The mechanism is Little’s Law: L = λW, where L is items in a pipeline, λ is arrival rate, and W is average time per item. AI increases λ (more PRs entering review) without reducing W (review time per PR). Average PR size increased 154%.[3] Code review throughput is bounded by reviewer cognitive capacity, not by how fast the author generates a diff.
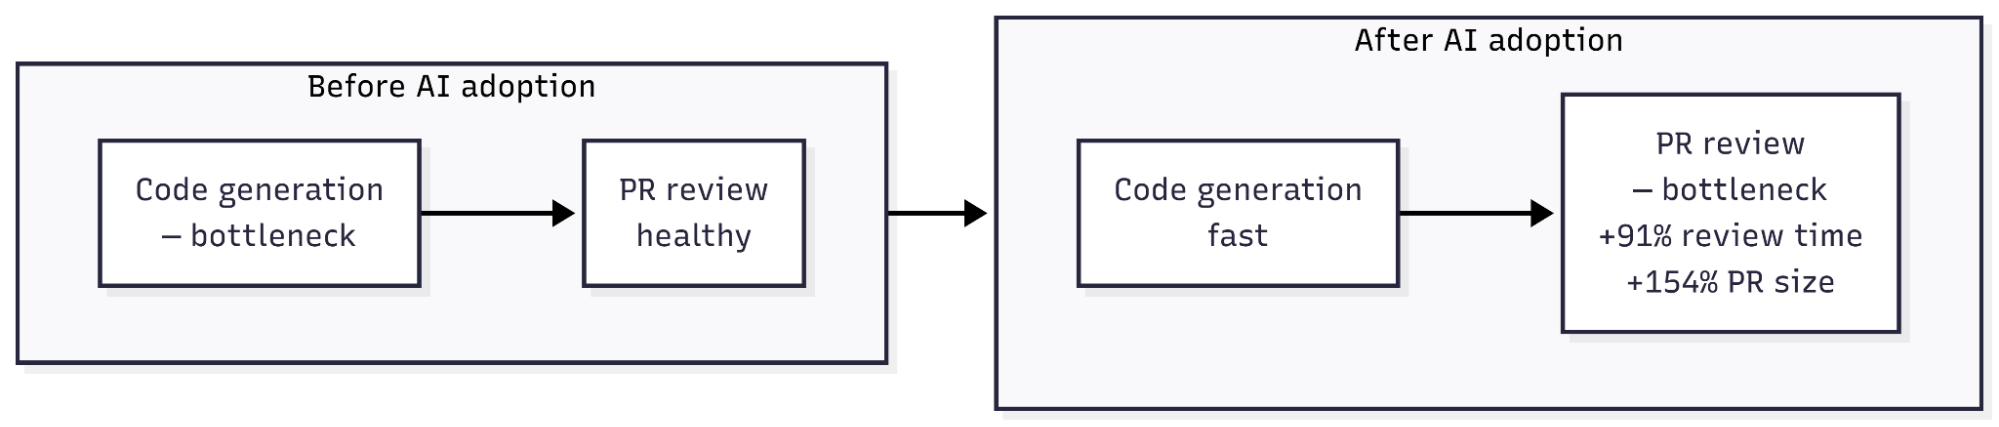
PR review time increased 91% across the Faros dataset.[3] Bugs per developer increased 9%.[3] Cisco case study research suggests diminishing review effectiveness above roughly 300 to 400 lines per session, with reviewers shifting from systematic analysis to pattern matching.[4] A 154% increase in average PR size pushes most reviews past that threshold.
Anthropic’s internal study of 132 engineers adds a compounding factor: 27% of Claude-assisted work is additive — work that would not have been attempted without AI.[5] Engineers using Claude in 59% of their daily work report a 50% productivity boost.[5] Under Little’s Law, additive work is new WIP injected into the pipeline. More gets started, but delivery frequency does not improve.
This is not an argument against AI tooling. It is an argument about system boundaries. The constraint moved from code generation to code review. Optimising generation further without addressing the review constraint is local optimisation of a non-bottleneck step.
The Diagnostic: Three Instrumentation Questions
1. Where is your cycle time actually constrained?
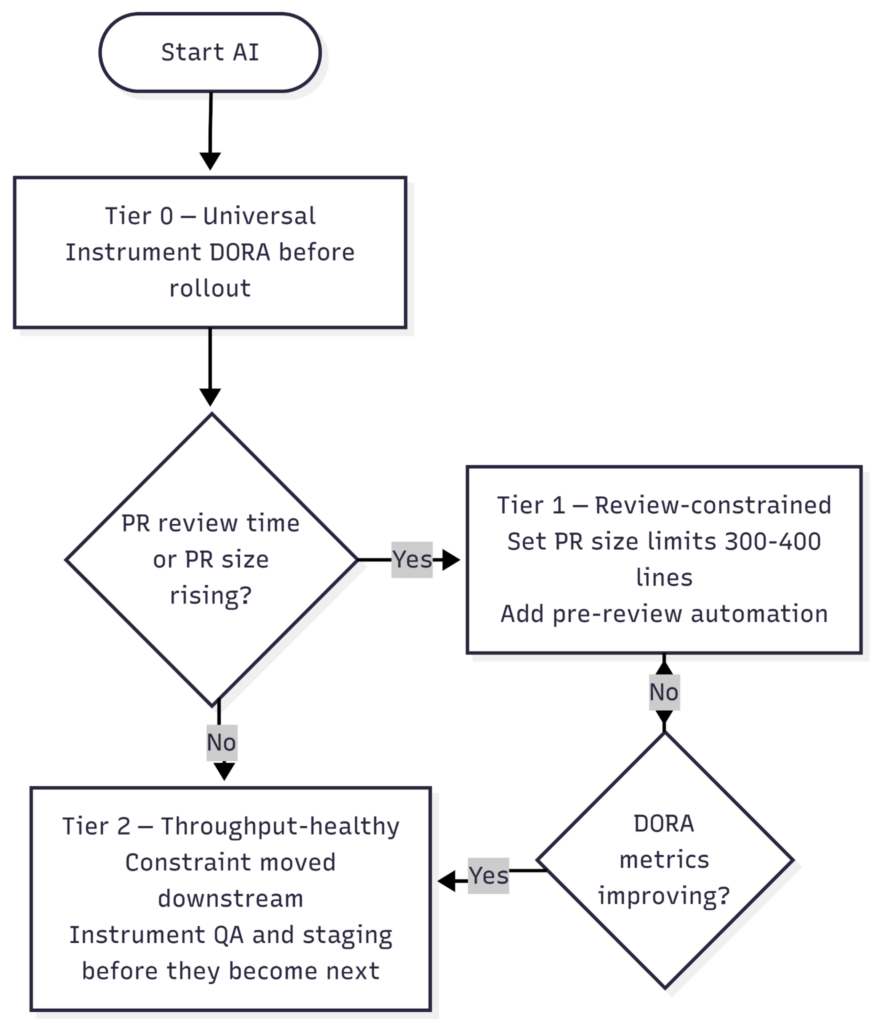
Baseline DORA before rollout: deployment frequency, lead time for changes, change failure rate, and mean time to restore. Break lead time into pipeline stages: commit to PR open, PR open to first review, first review to merge, and merge to deploy. AI adoption compresses the first stage and expands the second if review is already constrained. Tooling that surfaces this natively includes LinearB, Faros, Sleuth, and the DX platform.
2. Are you tracking the ratio that matters?
PRs opened versus PRs merged per unit time is the leading indicator of WIP accumulating in the review queue. Pair with the average PR size trend. If both are rising, the bottleneck has shifted and more AI adoption worsens it before any other change takes effect. Set PR size governance alongside AI rollout — not as a follow-on project. Automated pre-review gates (static analysis, coverage delta checks, dependency diff summaries, and similar) reduce reviewer cognitive load without adding headcount.
3. Are you separating additive work from substitutive work in your capacity model?
Developer satisfaction with AI tools correlates with measured time savings at only r=0.34, and 60% of developers report saving less than one hour per week despite high satisfaction rates.[6] Survey data is not a proxy for throughput. A pilot result of “engineers feel more productive” is reproducing the perception gap the METR RCT documented: a systematic overestimate that persists even after objective contrary evidence is presented.[1]
Use DORA instrumentation from your CI/CD pipeline for delivery unit tracking. Use developer experience surveys for qualitative signals about friction and satisfaction. Never use the second as evidence for the first.
The Transformation Has Just Started
The bottleneck shift is the most important signal in the Faros data — and it is an optimistic one.
The −19% METR result does not mean AI fails at software engineering. It means we have automated one stage of a multi-stage delivery pipeline while leaving every downstream stage untouched. The code generation bottleneck is gone. The review bottleneck is now exposed.
That is precisely how constraint-based systems are supposed to work. Solving one bottleneck reveals the next one. This is progress, not failure.
The 80% conversation-level speedup is real. It is currently inaccessible at the delivery level because the same automation has not yet reached what comes after the conversation. Full realisation of that gain requires the same approach applied to the full SDLC: automated code review support, AI-assisted QA and staging validation, AI-assisted PR routing to reviewers by expertise and current load, and workflow automation for the non-technical roles whose review and approval steps are now the pacing constraint as engineering output increases. Product, design, and compliance sign-offs do not move faster because the engineer submitted the PR faster. The whole system must move together, not one stage of it.
There is a compounding cognitive load problem that worsens without explicit WIP discipline. A 154% increase in average PR size does not just slow review throughput — it increases the working memory burden on every reviewer.[3] Engineers using AI generate more code faster, but reviewers must still construct a mental model of every change. Cognitive load per unit of code delivered is rising without a corresponding increase in reviewer capacity. The result is not just slower review, it is lower review quality, more bugs reaching production, and reviewer fatigue that is invisible in satisfaction surveys. The author carries a compounding cost too. Returning to a PR after days of context drift requires rebuilding the mental state that negates part of the generation speedup. The more AI accelerates code generation without a corresponding investment in review infrastructure, the faster this curve bends toward diminishing returns.
The human systems corollary is straightforward: treat the reviewer as the constraint and organise around that fact. That means finishing what you started before opening new work. A PR sitting in the review queue is not done — it is WIP. Engineers who open ten PRs while waiting on review have not created ten times the value; they have injected ten times the cognitive load into the team’s review pipeline. The engineer who clears the review queue moves the team’s throughput. The engineer who opens the tenth simultaneous PR has not moved it: they have moved it backward.
The teams that extract the full benefit of AI tooling over the next two years will not be the ones who adopt the most AI. They will be the ones who instrument the full delivery pipeline, treat code review capacity as a first-class engineering resource, automate the stages downstream of code generation, and move the constraint forward deliberately rather than discovering it after the fact through rising cycle times and escaped bugs.
The productivity gain is real. The transformation is in progress. 80% are waiting downstream.
Author
Buğra Sitemkar is a software engineer at Zartis specialising in Microsoft Stack and Azure. He’s passionate about applied AI and building GenAI tooling. He occasionally moonlights as a hardware hacker.
Sources
- Measuring the Impact of Early-2025 AI on Experienced Open-Source Developer Productivity — METR, 2025.
Link
↩ - Estimating the Productivity Impact of Generative AI — Anthropic Research, 2025.
Link
↩ - The AI Productivity Paradox in Software Engineering — Faros AI, 2025.
Link
↩ - Code Review at Cisco Systems — Cisco, 2006.
Link
↩ - How AI Is Transforming Work at Anthropic — Anthropic Research, 2025.
Link
↩ - Beyond the Commit: Developer Perspectives on Productivity with AI Coding Assistants — arXiv (BNY Mellon), 2026.
Link
↩