Once you release your software to production, you want to make sure it succeeds in being a valuable resource for your customers or clients. So, it becomes a priority to keep it highly available and to take swift and definitive actions when it comes to addressing problems. Using Application Insights, you can increase your product confidence and address issues in real-time.
Michal Szymczak, Tech Lead at Zartis shares his expertise on collecting business critical information using Azure Application Insights. Check out his full webinar on this topic here.
But first things first, what is Application Insights?
Application Insights is a feature of Azure Monitor, and it is an extensible Application Performance Management (APM) service for developers and DevOps professionals, used to monitor your live applications.
In an ideal scenario, where you are confident about the ongoing success of your product, you should be able to answer these questions right off the bat:
- Are all system components communicating with one another?
- How quickly can you find an issue in your product?
- How do you go about checking what went wrong? Did you guess, or did you come up with a hypothesis using scientific information?
- Can you fix your issue quickly?
- Once it’s done, do you know if it’s fixed or not?
- And most importantly, who finds out about the problem first? Is it you or your clients?
By being able to address these questions with certainty and speed, you can increase your products’ reliability and reputation. Azure Application Insights is an offering from Microsoft Azure and if you’re on Azure already, it’s very easy to start using the service. If you’re not using Azure – it also has a free tier you can utilize.
App Insights is a telemetry application, which monitors operations of various applications and products you might have, regardless of whether it’s an API, an MVC application, a background data processor, a front-end application, or a mobile app etc. You have a number of SDKs available for App Insights. That means it’s going to work not only with .NET and C#, but also with Java and others. We’ve even found an SDK for PHP recently. Using an SDK is the most obvious choice, especially for developers, but you can also do codeless monitoring.
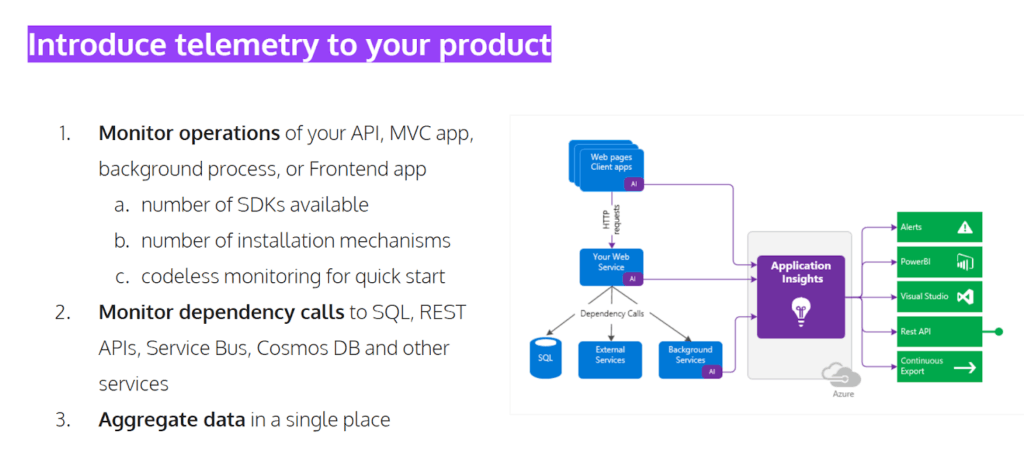
What Application Insights is going to do for you is to monitor various dependencies. If you have other resources apart from Azure – like dependencies on SQL or NoSQL databases, Rest and other RestAPI services, service bus instances etc – all these dependencies, all these calls, all these interactions between your product and those services are going to be recorded. Even if you have microservices scattered around a number of those, Application Insights is going to aggregate it all into a single place. Arguably, this is a huge benefit, because it allows you to query everything in one place.
Furthermore, you can also relate different components to one another and check whether there are certain interactions or correlations you need to consider. As you can see in the graph, above, you can export insights, or you can work with the API directly on Azure Portal. You can also export to Power BI, or a custom data source, as maybe you want your data team to take a look at it.
Let’s take a deeper look into the 3 most important techniques to utilize with App Insights:
- Monitoring the availability of systems
- Understanding product operations
- Making the information transparently available
Monitoring the availability of systems using Application Insights
Monitoring the availability of your application is something that we’re going to refer to as health checks. You want to ensure your product is reachable for your clients and fully operational. You also want to get notified as soon as something goes wrong.
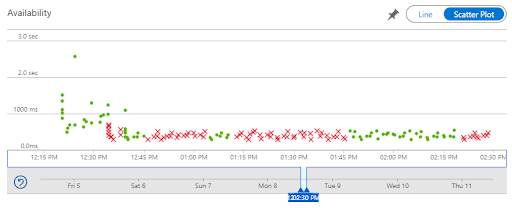
In the graph above, which was actually generated by Application Insights, you can track availability following the green dots, whereas the red crosses show you when your product isn’t fully available. You can have certain checks across the globe and see if that application is available from Spain, US or Japan. The fact that you can get notified in real time is the most important aspect, as you can act before your clients even know something went wrong.
Ideally, for health checks you should implement core dependencies. If you require an SQL database connection for the application to work, include that in your health check so that if you cannot communicate with the database, the service is going to be identified as unhealthy, and you’ll be able to react.
If you have resources that are not core, for instance – Redis Cache, which might enhance your application, but are not fully required for the application to work, consider those additional dependencies as well. It’s your call, whether you want to say the degradation of the service is fine, or if you consider that application unhealthy altogether.
Something very useful here, especially if you’re working with ASP.NET Core, is to take a look at this project which is called Diagnostics Health Checks on Github, and you’re going to get a huge list of health checks, which the community has provided.
Understanding product operations using App Insights
So, now we have our health checks, but let’s be honest, that’s pretty high level information about your system – if it is working and which components are potentially failing but that’s pretty much it. The power of Application Insights comes from understanding your product operations. App Insights is going to collect telemetry information for you, which is pushed from your product to its servers. The types of things that are collected are requests, exceptions, metrics, dependencies, trace (== your logs), custom events:
By default all unhandled exceptions are going to be logged for you, but you can also log specific exceptions in your code as well.
You can monitor metrics such as the CPU utilization, storage available, memory usage etc. If you’re processing data overnight, you may want to see how many requests to process you’ve got in your queue or at all times.
We mentioned dependencies such as SQL, other APIs, Service Bus – and these come built in, but you can have your own dependencies if there is something very specific that you’re using like third party service through an uncommon connection mechanism, you can code that yourself.
Utilise trace logs to enhance your debugging sessions or Production failure analysis with low-level information.
And finally, you can have custom events. This is useful for development but also for product related aspects. With Application Insights things can be technical, but they can also be business oriented. For example, if you want to know when a new client signs up, if somebody purchased something or entered a specific level of the game – you can get notified every time that happens. Those are some examples of the things you might want to be notified for as they might trigger or influence some of your business decisions.
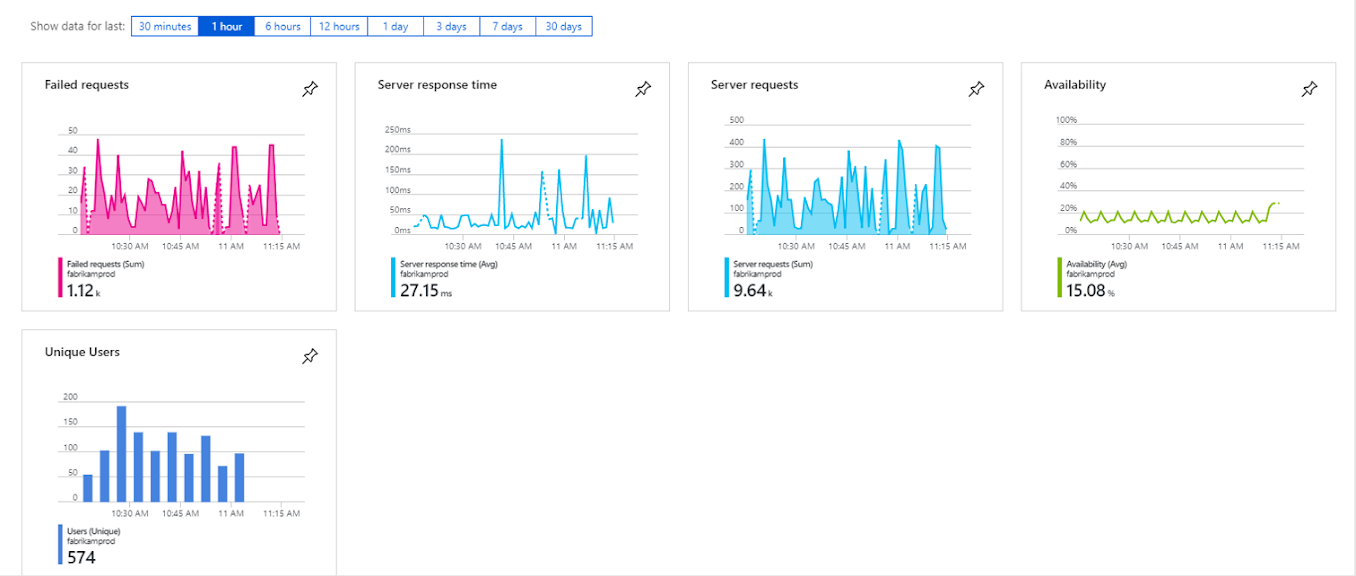
Above you have some basic graphs showing availability and request response time. All requests come back to Insights with response times, so you can get the averages and see if certain requests take longer than the average or if some of them are particularly quick.
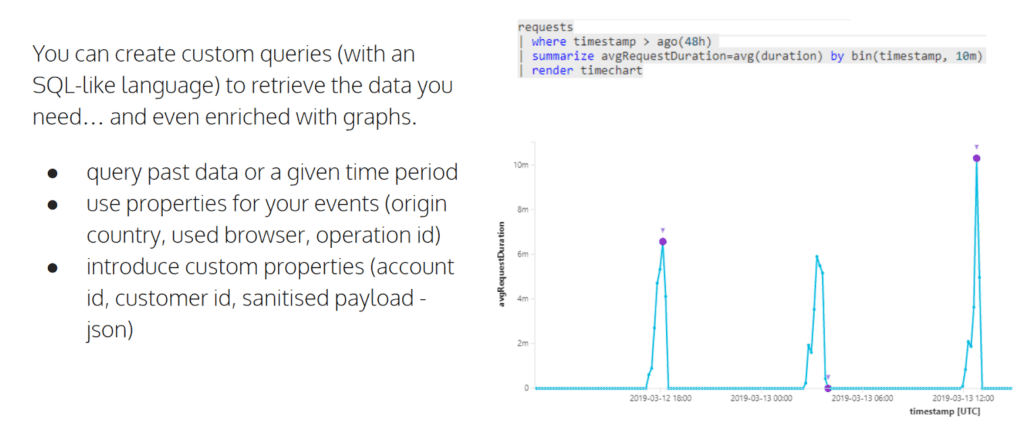
At a certain point, you will realize that effectively you need more. You want to be able to make queries yourself, you want to be able to create graphs yourself. There is an option to query your logs through something that’s called a custom query language. It’s an SQLite language which allows you to retrieve data treated as a relational database and you can even enrich those results with graphs, as you can see in the picture below:
You can use properties for your events. Some come built-in like origin, country, used browser, and Operation ID.
Let’s take a deeper look into Operation ID, as it is an interesting one. With every request coming in, every log that’s going to happen is going to have a unique identifier. However, when you request, for instance, a product page to show up, it actually can generate a number of calls to the database to get the product and the stock availability from a microservice, which is going to check if the products are available at all, and other calls. All of those are going to share the Operation ID, which is then going to make it very easy for you to just query by that Operation ID and see all the requests and all the telemetry that’s related to it. As you can probably imagine, that’s going to simplify your troubleshooting sessions immensely.
Another cool functionality of Application Insights is that you can see the map of dependencies – essentially a map of the application. You are able to see all the components of your application, the relations between them, their health – both individually, as well their overall performance in a single graph.
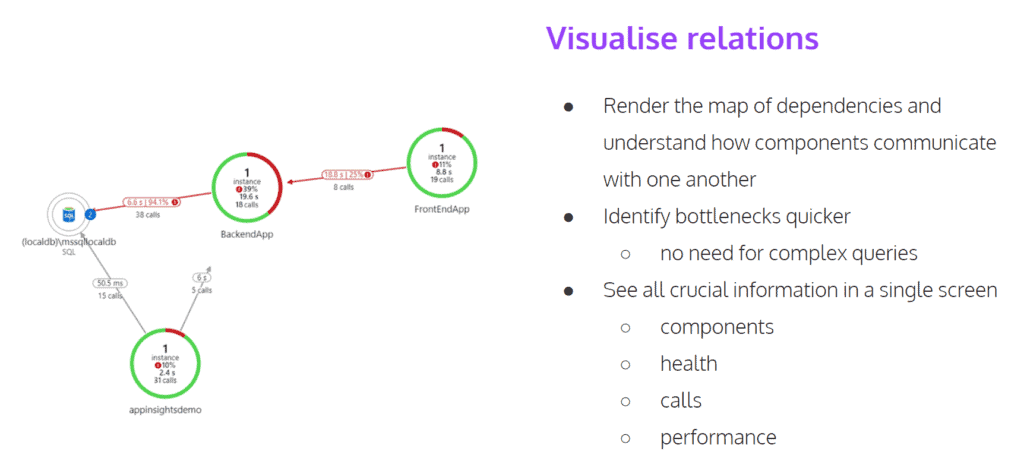
Very often, this’s a very good place to start your analysis. Also, this can be a very useful tool when introducing your system to new developers who join your team. You can show them all the components, the most recent architectural graphs, what the development team is currently working on and more.
Making the information transparently available
So we have collected all this information through health checks, we have collected all this telemetry, finally we can now query and visualize things. What’s super important is to ensure all this data is available for your team and that you train people or show them how to use it. If you are a Team Lead, and you hog all these capabilities and information to yourself, it’s not going to work. If other team members are properly utilizing Application Insights when you’re unavailable, they will be able to quickly handle problems.
To see the benefits of implementing Application Insights in your application, you need to train your software developers to use the data from it.
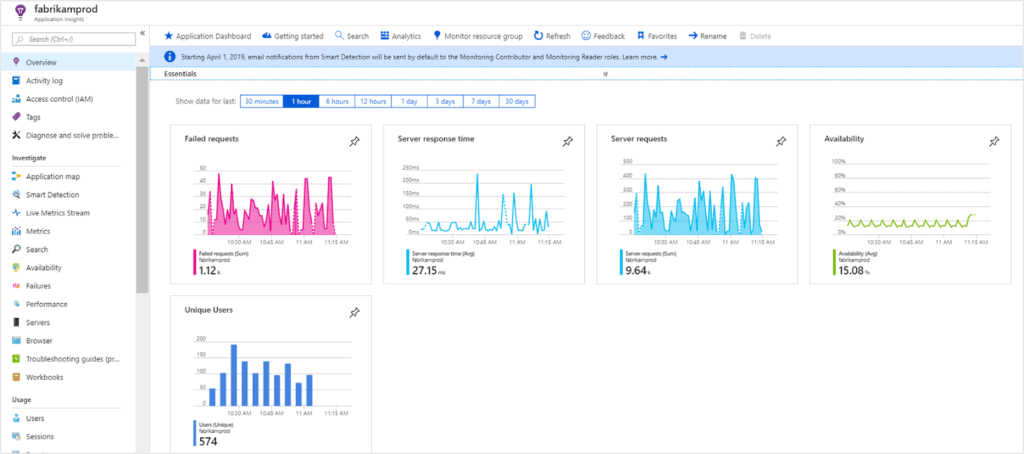
One way to get your team involved is to create dashboards. Let’s check this example below. On the left hand side, you’ve got information available from App Insights. And on the right hand side, you’ve got some additional security and network information. So you can have dashboards that span across multiple pieces of information. Just by looking at these graphs, you’re going to be able to identify:
- What are the failed operations?
- What’s the breakdown of the users you’ve got?
- What’s the availability of your product?
- What’s the timeline, and the average response time?
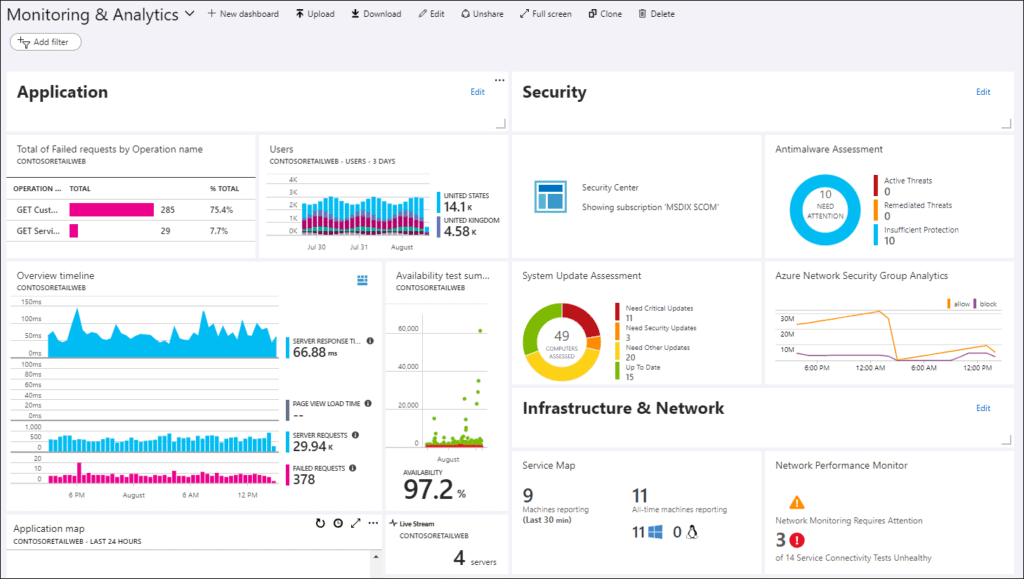
If your teams have the habit of checking this when they suspect something’s not working, or when they have been notified that something’s not working, they are going to have all the information available at their disposal very, very quickly.
Now the challenge is to set up the right notification system, so that the right people can act on the specific problem at the right time. For business critical situations, you have to act swiftly, whether that’s within your business hours, or not. You want to be able to notify your team if something happens and the monitoring capabilities of Application Insights allow you to do that. You can send an email or an SMS, a push notification, you can send a slack notification. You can use web hooks to actually be able to notify relevant services about a certain situation.
Slack is not really supported out of the box. However, there is a logic app which you can install into your Azure environment and it’s going to be capable of using that web hook to send it over to the web hook of Slack. So it’s not a direct line, but it’s available.
If there is a problem with the health check, you can notify a different group of people compared to the people you would notify for a degradation in the performance of the app. But still, you need to push information through rather than pull information. This way you can also eliminate the inevitable human error and be clever about it. You don’t want your team members to get notified every single hour because then they are going to get numb for this kind of notification.
If you want your team members to be able to go home and have a good night’s sleep after they’ve just released something super important to production, make sure they have this available to them. As soon as something happens they will know that they have tools at their disposal and they don’t have to guess anymore.
After months of using Application Insights, they will develop this organical product confidence.
Confidence is a science, it is not faith. We should have confidence in our product and we should base it on specific scientific information.